ChartWidgets
Live US economic charts explained in plain English, free to embed on your website.
Visit Website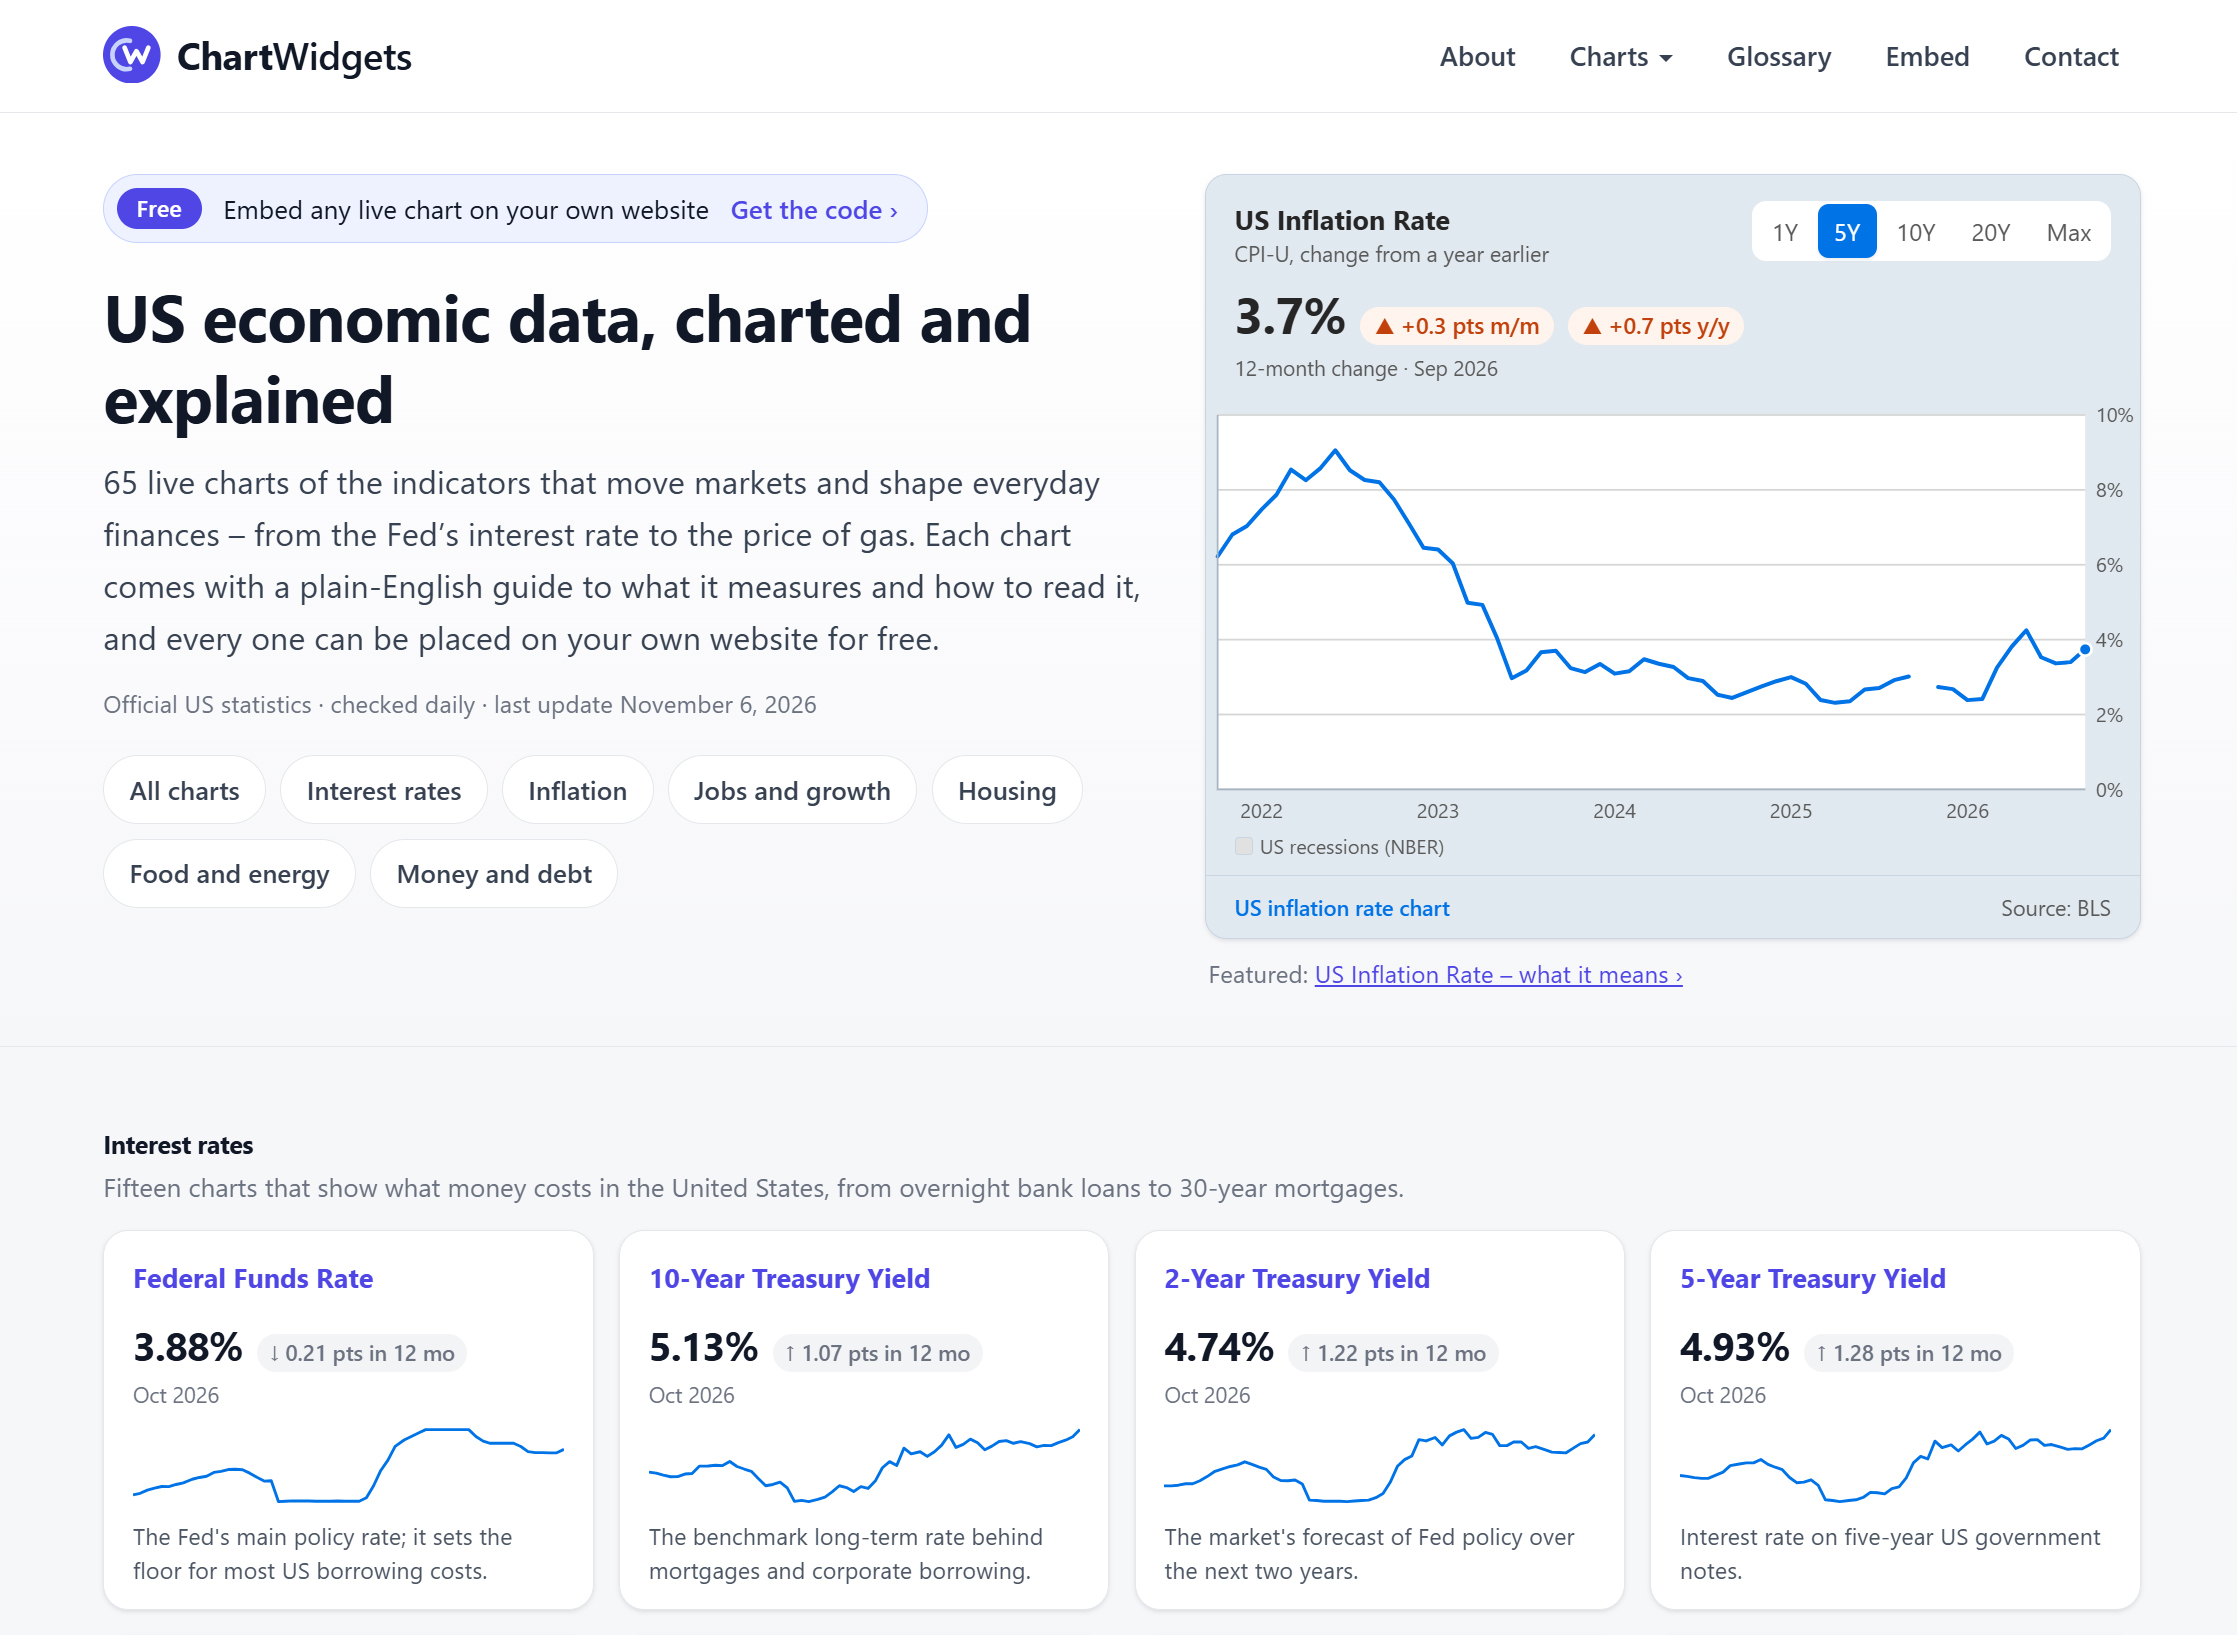
About ChartWidgets
ChartWidgets is a free library of 65 live charts built on official US economic statistics. It covers the indicators that move markets and shape everyday finances, including the Fed's interest rate, Treasury yields, inflation, jobs, housing, food and energy prices, and money and debt. Each chart includes a plain-English guide explaining what it measures and how to read it. The data is checked daily and was last updated November 16, 2026.
The main feature is embedding. Any live chart can be placed on a third-party website for free by copying a code snippet, so the charts stay current without manual updates. Charts are grouped into categories such as Interest Rates, Inflation, Jobs and Growth, Housing, Food and Energy, and Money and Debt, and a featured guide to the US inflation rate is highlighted on the homepage.
ChartWidgets is aimed at website owners, publishers, bloggers, educators, and finance writers who want accurate, up-to-date economic data on their pages without building their own charts or doing the research to explain them. It also suits general readers who want to understand economic indicators without specialist training.